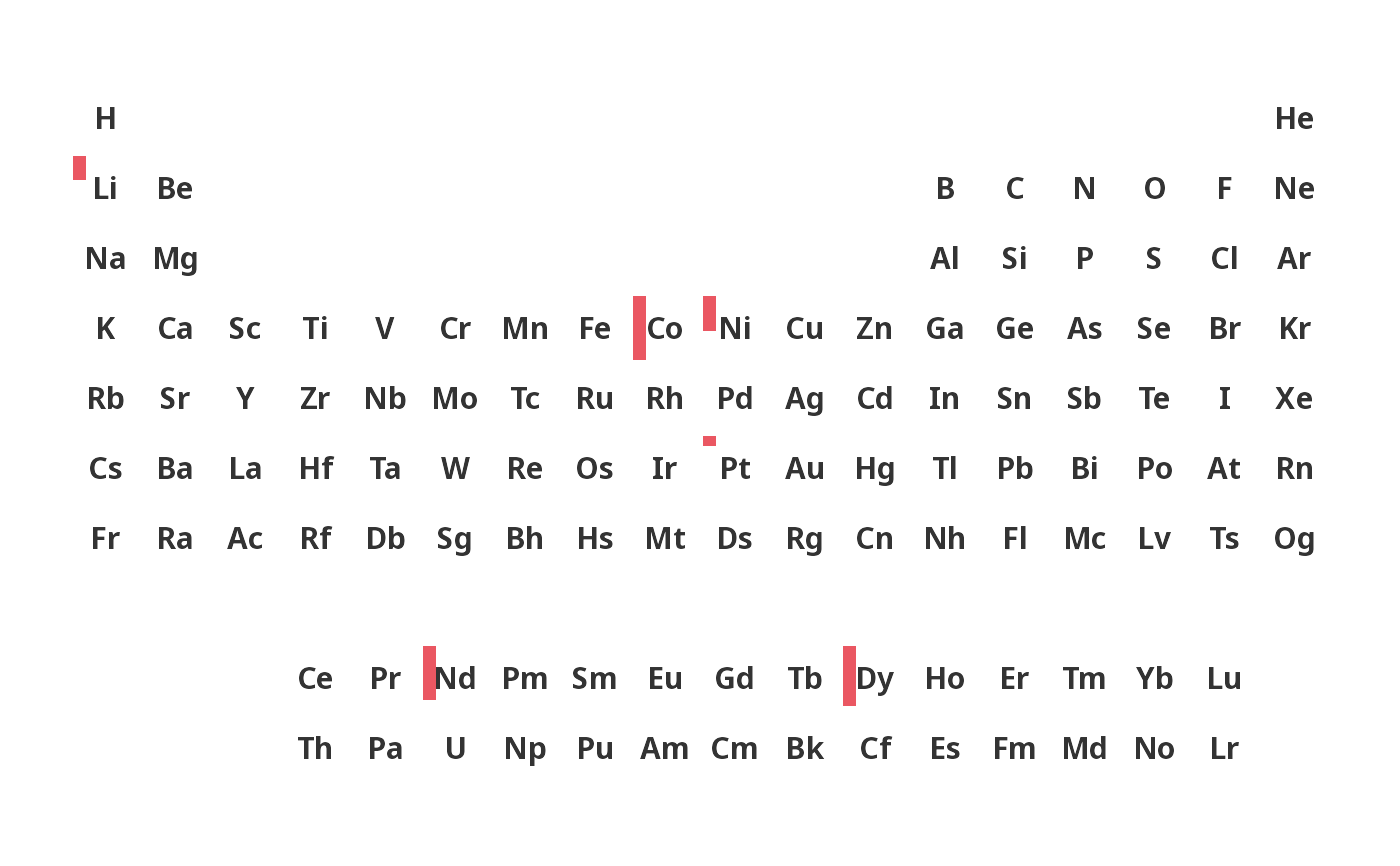
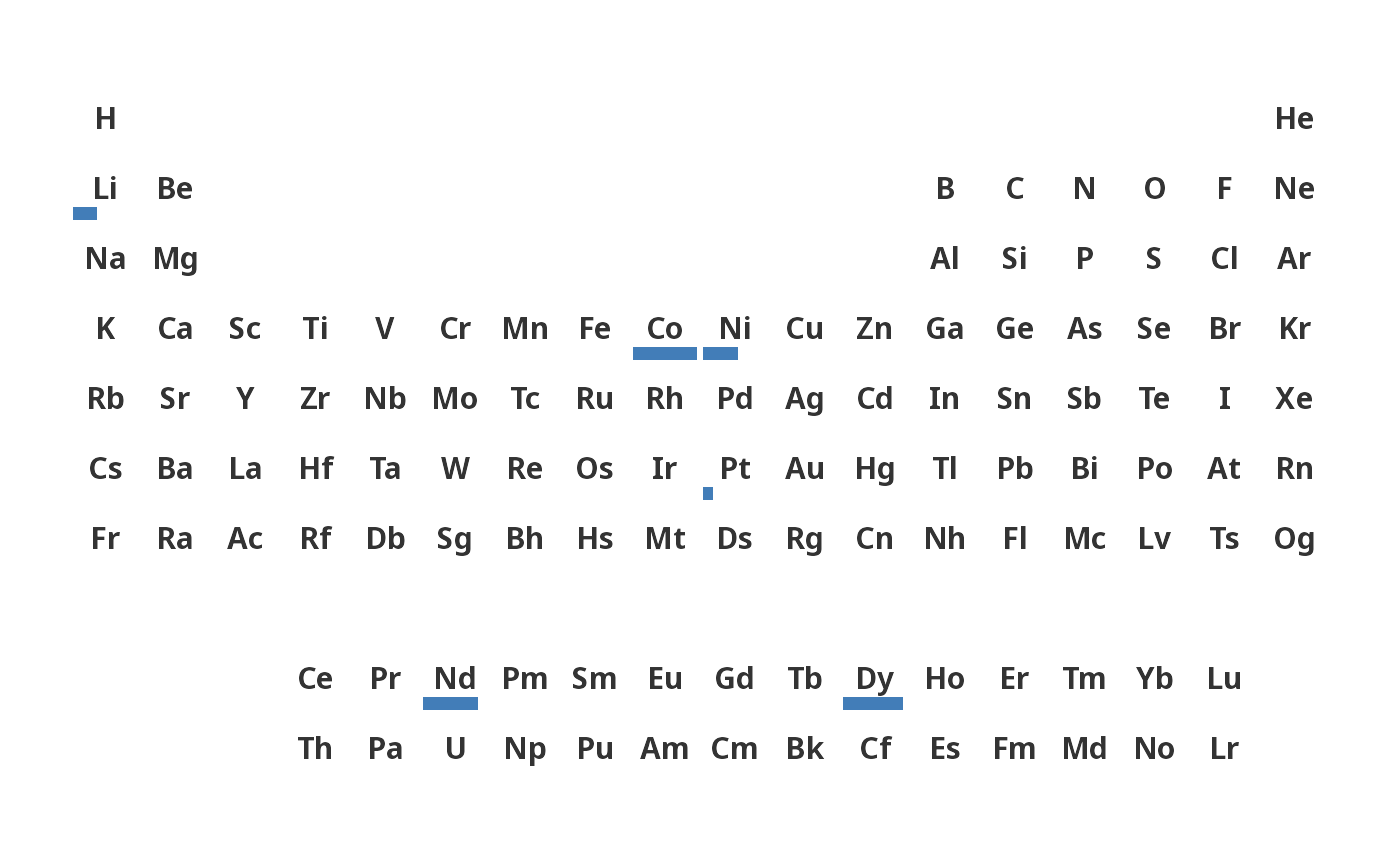
Maps a continuous value to the length of a bar drawn inside each element tile. The bar occupies a fixed thickness along the chosen edge and grows in length proportionally to the normalised value. All tiles are drawn in a neutral background so the bars are the primary visual signal.
Usage
ggPSE_bar(
  data = NULL,
  value_col = NULL,
  symbol_col = "symbol",
  bar_side = "bottom",
  bar_color = "#2166ac",
  bar_alpha = 0.85,
  bar_thickness = 0.2,
  color_na = "#ffffff",
  tile_border = "transparent",
  legend_title = NULL,
  show_atomic_number = FALSE,
  base_size = 10
)
Arguments
- data
A data frame containing element symbols and a value column. If NULL, a blank table is drawn.
- value_col
Character. Column in data to map to bar length.
- symbol_col
Character. Column in data containing element symbols. Default "symbol".
- bar_side
Character. Edge from which the bar grows. One of "bottom" (default), "top", "left", or "right".
- bar_color
Hex fill color for bars. Default "#2166ac".
- bar_alpha
Numeric. Bar opacity 0-1. Default 0.85.
- bar_thickness
Numeric. Thickness of the bar as a fraction of the tile. Default 0.2 (20 percent of tile height/width).
- color_na
Hex color for tile backgrounds. Default "#ffffff".
- tile_border
Hex color for tile borders. Default "transparent".
- legend_title
Character. Legend title. Defaults to value_col.
- show_atomic_number
Logical. Show atomic numbers. Default FALSE.
- base_size
Numeric. Base font size in pt. Default 10.
Examples
supply_risk <- data.frame(
symbol = c("Li", "Co", "Nd", "Dy", "Pt", "Ni", "Cu"),
risk = c(0.62, 0.91, 0.84, 0.88, 0.52, 0.70, 0.45)
)
# Bar growing from the bottom
ggPSE_bar(supply_risk, value_col = "risk",
legend_title = "Supply risk")
 # Bar growing from the left
ggPSE_bar(supply_risk, value_col = "risk",
bar_side = "left", bar_color = "#e63946",
legend_title = "Supply risk")
# Bar growing from the left
ggPSE_bar(supply_risk, value_col = "risk",
bar_side = "left", bar_color = "#e63946",
legend_title = "Supply risk")