The core plotting function of ggPSE. Returns a ggplot2 object that can be further modified.
Usage
ggPSE(
  data = NULL,
  value_col = NULL,
  symbol_col = "symbol",
  label_value = TRUE,
  value_digits = 2,
  color_low = "#fdf0f2",
  color_high = "#9a031e",
  color_na = "#f0f0f0",
  tile_border = NULL,
  highlight = NULL,
  legend_title = NULL,
  show_atomic_number = FALSE,
  base_size = 10,
  groups = NULL,
  periods = NULL,
  lanthanides = TRUE,
  actinides = TRUE
)
Arguments
- data
A data frame containing element symbols and a value column. If NULL, a blank table using the NA color is drawn.
- value_col
Character. Column name in data to map to fill color.
- symbol_col
Character. Column in data containing element symbols. Default "symbol".
- label_value
Logical. Print numeric values inside tiles. Default TRUE.
- value_digits
Integer. Decimal places for displayed values. Default 2.
- color_low
Hex color for the low end of the gradient. Default "#fdf0f2".
- color_high
Hex color for the high end of the gradient. Default "#9a031e".
- color_na
Hex color for elements with no data. Default "#f0f0f0".
- tile_border
Hex color for tile borders. If NULL (default), grey border on light backgrounds, transparent on dark. Set "transparent" to suppress.
- highlight
A list of highlight groups. Each group is a list with:
- symbols
Character vector of element symbols to highlight.
- color
Fill color for highlighted tiles.
- label
Optional legend label for this group.
Example:
list(list(symbols = c("Li","Co"), color = "#2166ac", label = "Battery metals"))- legend_title
Character. Legend title. Defaults to value_col.
- show_atomic_number
Logical. Show atomic numbers in top-left of tile. Default FALSE.
- base_size
Numeric. Base font size in pt. Default 8.
- groups
Integer vector of length 2. Range of IUPAC groups (columns) to display, e.g.
c(3, 12)for transition metals only. Default NULL shows all groups.- periods
Integer vector of length 2. Range of periods (rows 1-7) to display, e.g.
c(4, 6)for periods 4 to 6. Default NULL shows all periods. Note: lanthanides and actinides are controlled separately vialanthanidesandactinides.- lanthanides
Logical. Show the lanthanide row. Default TRUE.
- actinides
Logical. Show the actinide row. Default TRUE.
Examples
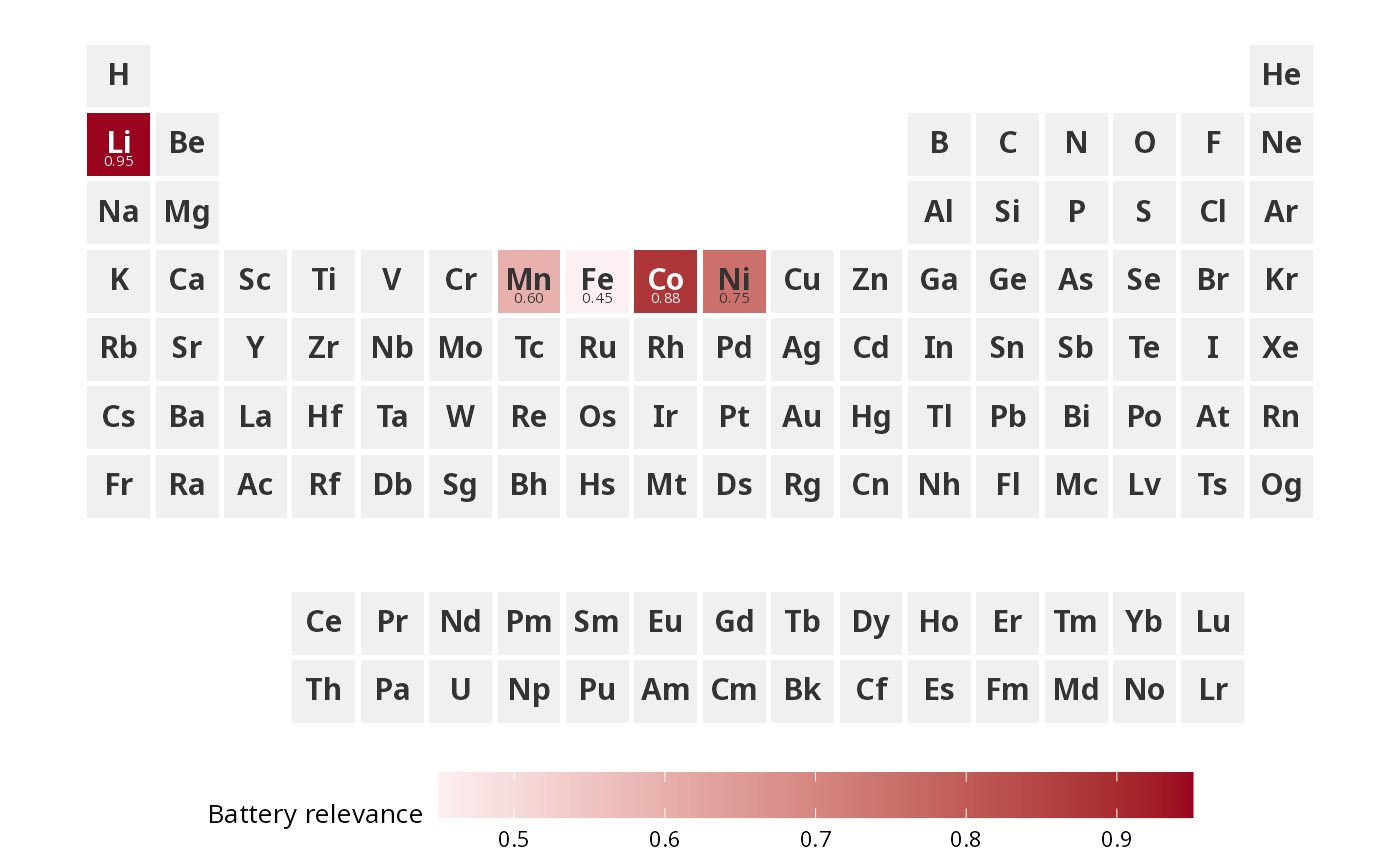
battery <- data.frame(
symbol = c("Li", "Co", "Ni", "Mn", "Fe"),
importance = c(0.95, 0.88, 0.75, 0.60, 0.45)
)
ggPSE(battery, value_col = "importance", legend_title = "Battery relevance")
 ggPSE(highlight = list(
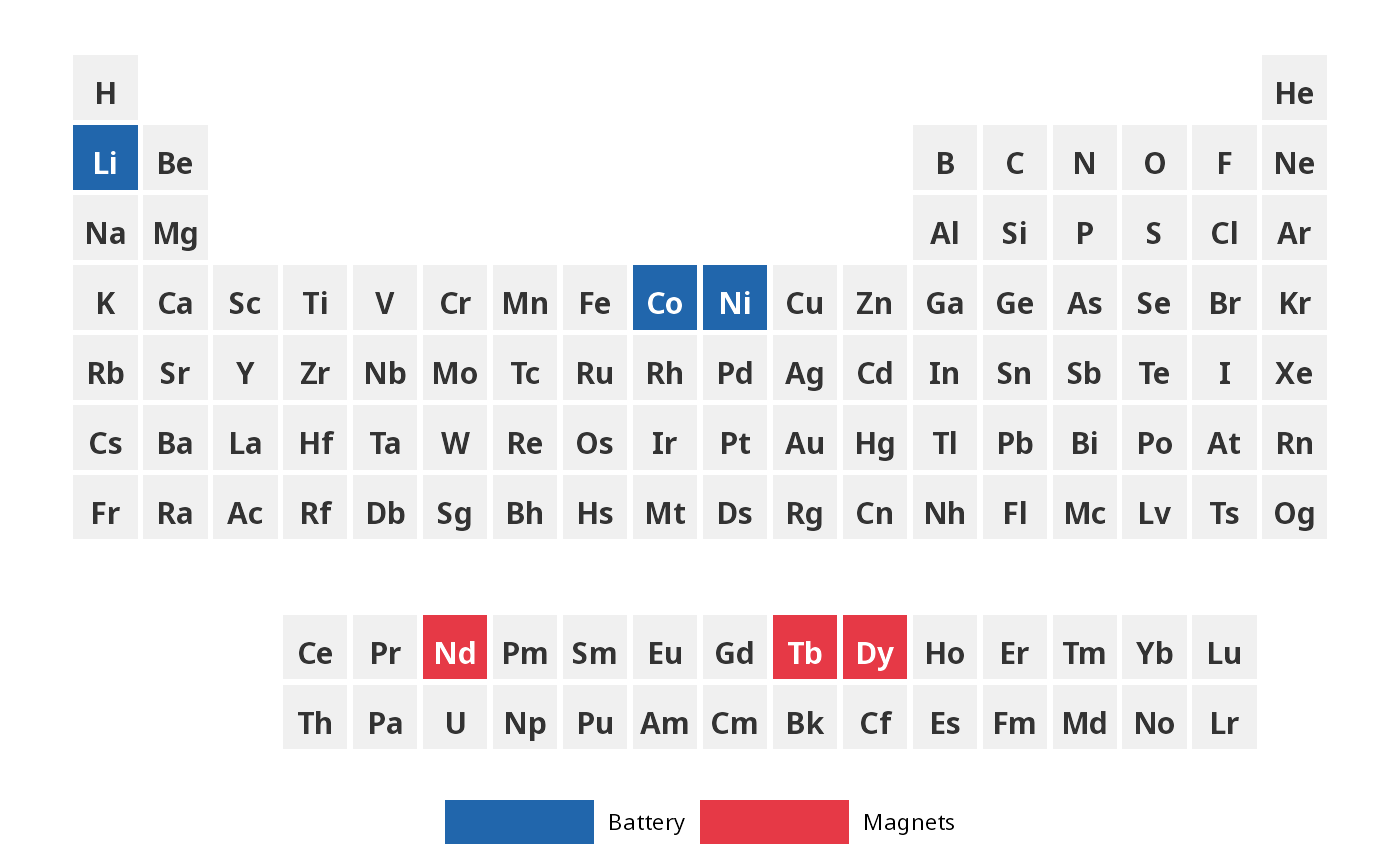
list(symbols = c("Li", "Co", "Ni"), color = "#2166ac", label = "Battery"),
list(symbols = c("Nd", "Dy", "Tb"), color = "#e63946", label = "Magnets")
))
ggPSE(highlight = list(
list(symbols = c("Li", "Co", "Ni"), color = "#2166ac", label = "Battery"),
list(symbols = c("Nd", "Dy", "Tb"), color = "#e63946", label = "Magnets")
))
 # Show only transition metals (groups 3-12, periods 4-6)
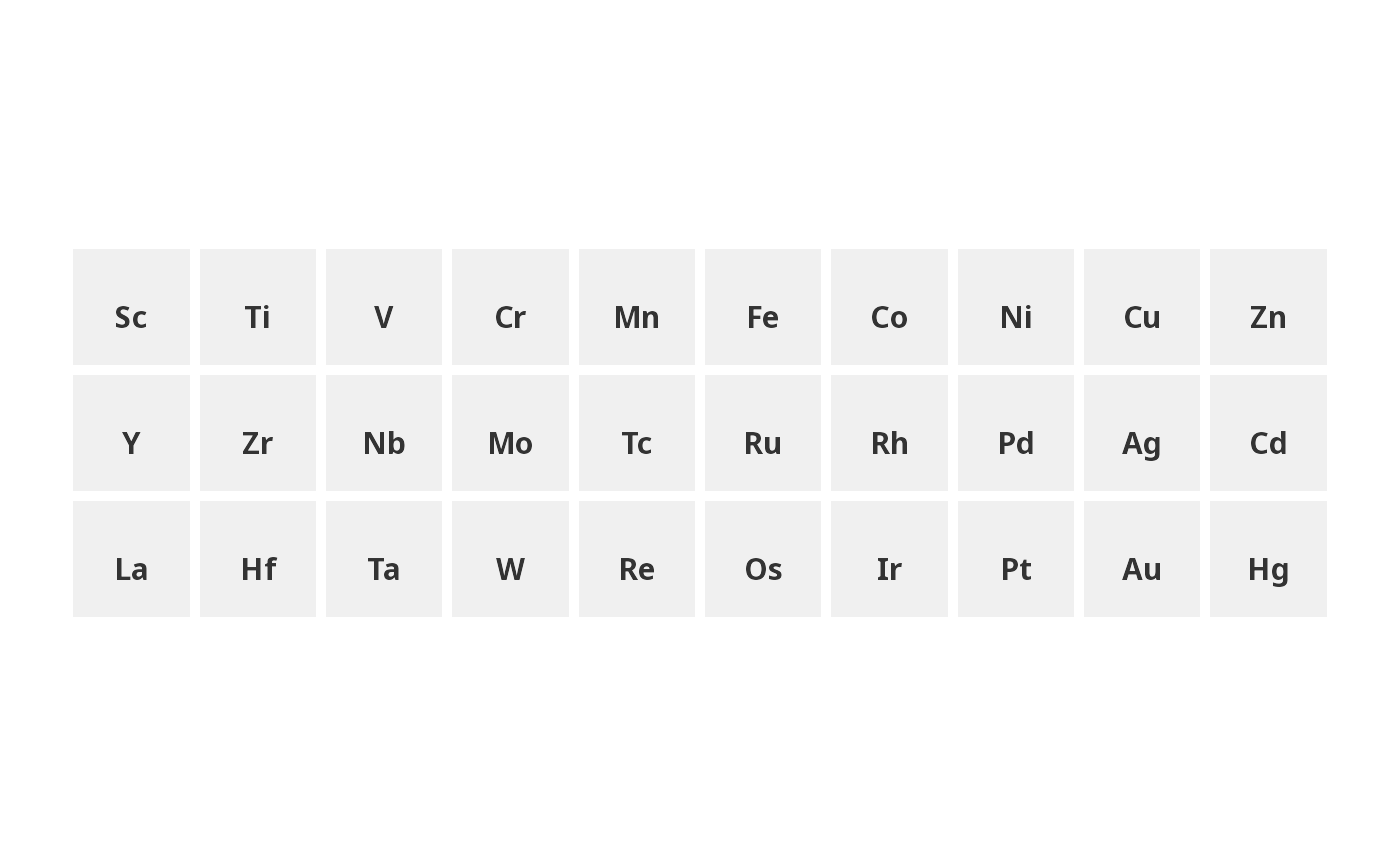
ggPSE(groups = c(3, 12), periods = c(4, 6), lanthanides = FALSE, actinides = FALSE)
# Show only transition metals (groups 3-12, periods 4-6)
ggPSE(groups = c(3, 12), periods = c(4, 6), lanthanides = FALSE, actinides = FALSE)